2.13 Country of birth by population group*
African/ Black |
Coloured |
Indian/ Asian |
White |
Unspecified |
Total |
|
South Africa |
30,148,148 |
3,502,353 |
1,007,865 |
3,845,099 |
344,946 |
38,848,411 |
SADC countries |
413,133 |
7,792 |
2,140 |
102,529 |
4,091 |
529,685 |
Rest of Africa |
7,395 |
329 |
657 |
11,358 |
296 |
20,035 |
Europe |
4,661 |
529 |
783 |
209,144 |
2,081 |
217,198 |
Asia |
405 |
377 |
17,888 |
9,194 |
690 |
28,555 |
North America |
362 |
107 |
122 |
4,972 |
120 |
5,683 |
Central and South America |
1,772 |
138 |
204 |
6,476 |
98 |
8,689 |
Australia and New Zealand |
40 |
28 |
34 |
3,725 |
61 |
3,887 |
Unspecified/Other |
75,420 |
4,522 |
5,670 |
55,682 |
3,162 |
144,456 |
Total |
30,651,337 |
3,516,175 |
1,035,363 |
4,248,179 |
355,545 |
39,806,598 |
* Excluding institutions
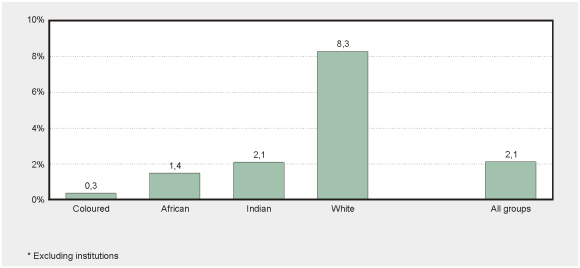
Percentage of the population who were not born in
South Africa by population group – October 1996*
• A larger proportion of whites (8%: second column from the right) were not born in South Africa compared to the other population groups.