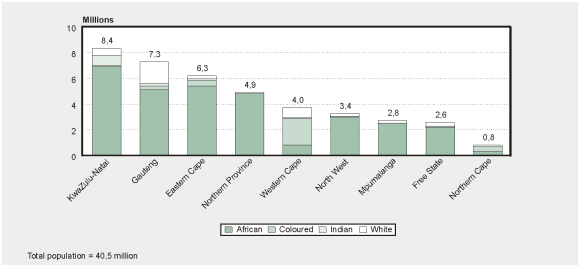
• Africans constitute the majority population in all provinces except two, Western and Northern Cape, where coloureds form the majority.
2.5 Population group by province (numbers)
Eastern |
Free |
Gauteng |
Kwazulu- |
Mpuma- |
Northern |
Northern |
North |
Western |
South |
|
African |
5,448,495 |
2,223,940 |
5,147,444 |
6,880,652 |
2,497,834 |
278,633 |
4,765,255 |
3,058,686 |
826,691 |
31,127,631 |
Coloured |
468,532 |
79,038 |
278,692 |
117,951 |
20,283 |
435,368 |
7,821 |
46,652 |
2,146,109 |
3,600,446 |
Indian |
19,356 |
2,805 |
161,289 |
790,813 |
13,083 |
2,268 |
5,510 |
10,097 |
40,376 |
1,045,596 |
White |
330,294 |
316,459 |
1,702,343 |
558,182 |
253,392 |
111,844 |
117,878 |
222,755 |
821,551 |
4,434,697 |
| Un- specified /Other |
35,849 |
11,262 |
58,654 |
69,423 |
16,120 |
12,208 |
32,904 |
16,635 |
122,148 |
375,204 |
Total |
6,302,525 |
2,633,504 |
7,348,423 |
8,417,021 |
2,800,711 |
840,321 |
4,929,368 |
3,354,825 |
3,956,875 |
40,583,573 |
Number of people in each province by population
group – October 1996
• Africans constitute the majority population in all provinces except two, Western
and Northern Cape, where coloureds form the majority.