2.37 Individual monthly income amongst the employed by population group, aged 15 - 65 years*
African/ Black |
Coloured |
Indian/ Asian |
White |
Unspecified |
Total |
|
None |
67,867 |
9,154 |
3,299 |
22,015 |
1,018 |
103,354 |
R1 - R200 |
636,718 |
56,697 |
5,762 |
28,561 |
3,991 |
731,729 |
R201 - R500 |
1,186,478 |
195,228 |
12,587 |
42,558 |
8,590 |
1,445,441 |
R501 - R1 000 |
1,293,717 |
216,618 |
39,445 |
76,298 |
11,248 |
1,637,326 |
R1 001 - R1 500 |
1,088,001 |
231,507 |
73,339 |
131,265 |
12,913 |
1,537,026 |
R1 501 - R2 500 |
667,021 |
180,879 |
76,952 |
253,713 |
11,944 |
1,190,508 |
R2 501 - R3 500 |
303,914 |
88,647 |
49,189 |
261,581 |
7,683 |
711,013 |
R3 501 - R4 500 |
154,853 |
48,656 |
30,908 |
228,432 |
5,309 |
468,158 |
R4 501 - R6 000 |
90,060 |
33,424 |
28,238 |
242,336 |
4,609 |
398,666 |
R6 001 - R8 000 |
34,873 |
12,595 |
13,771 |
160,617 |
2,256 |
224,111 |
R8 001 - R11 000 |
19,464 |
5,596 |
7,631 |
118,943 |
1,387 |
153,021 |
R11 001 - R16 000 |
9,406 |
2,335 |
3,857 |
74,709 |
719 |
91,026 |
R16 001 - R30 000 |
4,817 |
1,253 |
2,078 |
45,169 |
395 |
53,712 |
R30 001 or more |
2,070 |
465 |
858 |
17,677 |
151 |
21,221 |
Unspecified |
123,216 |
46,463 |
15,573 |
152,579 |
9,703 |
347,533 |
Total |
5,682,476 |
1,129,515 |
363,486 |
1,856,452 |
81,917 |
9,113,847 |
* Excluding institutions
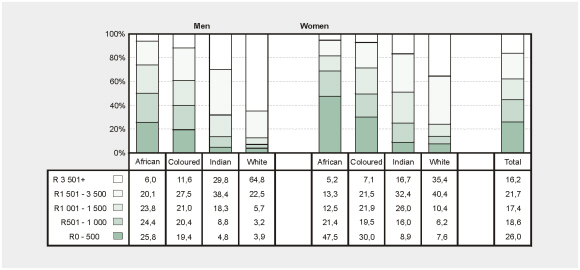
Income category among the employed by population
group and gender – October 1996
• Forty-eight percent of employed African women (lowest segment of the fifth column from the left) earn R500 or less per month, while 65% of white men earn more than R3 000 per month.