2.36 Individual monthly income amongst the employed by province, aged 15 - 65 years*
Eastern |
Free |
Gauteng |
Kwazulu- |
Mpuma- |
Northern |
Northern |
North |
Western |
South |
|
None |
12,562 |
6,815 |
22,829 |
20,655 |
7,087 |
1,926 |
10,510 |
9,590 |
11,381 |
103,354 |
R1 - R200 |
88,748 |
120,459 |
94,438 |
123,918 |
68,958 |
29,101 |
87,462 |
74,930 |
43,714 |
731,729 |
R201 - R500 |
139,093 |
133,285 |
261,406 |
272,529 |
132,732 |
57,388 |
132,078 |
131,750 |
185,180 |
1,445,441 |
R501 - R1 000 |
139,298 |
131,152 |
446,066 |
278,924 |
119,333 |
33,810 |
88,115 |
144,153 |
256,474 |
1,637,326 |
R1 001 - R1 500 |
117,556 |
114,104 |
475,290 |
253,291 |
85,769 |
26,398 |
76,169 |
137,136 |
251,312 |
1,537,026 |
R1 501 - R2 500 |
99,558 |
67,548 |
374,680 |
209,122 |
61,914 |
21,957 |
61,145 |
92,223 |
202,360 |
1,190,508 |
R2 501 - R3 500 |
61,422 |
40,004 |
228,649 |
123,130 |
36,385 |
13,434 |
43,114 |
47,934 |
116,941 |
711,013 |
R3 501 - R4 500 |
39,537 |
26,700 |
159,607 |
78,626 |
23,783 |
9,384 |
24,793 |
27,929 |
77,800 |
468,158 |
R4 501 - R6 000 |
30,734 |
22,324 |
144,152 |
67,816 |
20,479 |
8,130 |
16,944 |
19,710 |
68,377 |
398,666 |
R6 001 - R8 000 |
15,486 |
11,408 |
89,132 |
37,123 |
11,391 |
4,190 |
7,181 |
9,765 |
38,435 |
224,111 |
R8 001 - R11 000 |
9,595 |
7,188 |
66,008 |
24,368 |
7,017 |
2,358 |
4,168 |
5,692 |
26,628 |
153,021 |
R11 001 - R16 000 |
5,077 |
3,474 |
43,590 |
13,171 |
3,639 |
1,239 |
2,096 |
2,909 |
15,832 |
91,026 |
R16 001 - R30 000 |
2,728 |
1,771 |
27,274 |
7,238 |
1,796 |
764 |
1,079 |
1,574 |
9,488 |
53,712 |
R30 001 or more |
1,264 |
903 |
9,773 |
2,751 |
830 |
417 |
595 |
738 |
3,950 |
21,221 |
Unspecified |
24,159 |
14,039 |
121,348 |
57,912 |
24,812 |
5,028 |
14,679 |
19,254 |
66,301 |
347,533 |
Total |
786,818 |
701,175 |
2,564,243 |
1,570,573 |
605,925 |
215,523 |
570,129 |
725,287 |
1,374,174 |
9,113,847 |
* Excluding institutions
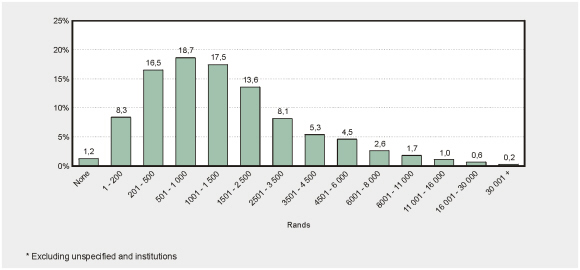
Monthly income of the employed (rands) –
October 1996*
• Summing up the first three columns on the left shows that 26% of the employed earn R500 or less per month, and summing up the first five columns shows that 62% of the employed earn less than R1 501 a month. However, only 11% earn more than R4 500 per month (the last six columns).
Percentage of employed people earning R500 per
month or less by province – October 1996*
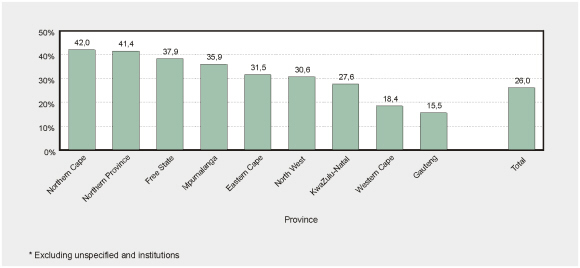
• Forty-two percent of employed people in Northern Cape earn R500 a month or less, compared with 16% in Gauteng.
Percentage of employed people earning more than R4
500 per month by province – October 1996*
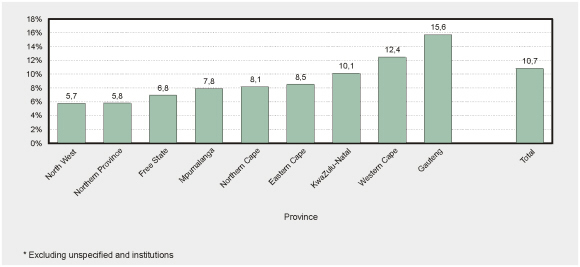
• Sixteen percent of employed people in Gauteng earn more than R4 500 a month, compared with only 6% in North West and Northern Province.