2.35 Economic sector amongst the employed aged 15 - 65 years by province*
Eastern |
Free |
Gauteng |
Kwazulu- |
Mpuma- |
Northern |
Northern |
North |
Western |
South |
|
Agriculture, hunting, forestry and fishing |
70,470 |
102,335 |
36,094 |
118,071 |
102,863 |
48,646 |
83,019 |
81,707 |
171,144 |
814,350 |
Mining and quarrying |
7,154 |
123,191 |
168,065 |
15,860 |
55,703 |
18,556 |
27,625 |
121,556 |
3,836 |
541,546 |
Manufacturing |
97,035 |
43,774 |
327,588 |
265,701 |
59,158 |
8,812 |
27,912 |
55,119 |
234,875 |
1,119,973 |
Electricity, gas and water supply |
5,598 |
7,363 |
36,522 |
14,103 |
17,800 |
2,397 |
6,954 |
7,532 |
11,064 |
109,334 |
Construction |
43,635 |
32,122 |
158,359 |
85,021 |
41,540 |
10,402 |
42,790 |
38,885 |
102,375 |
555,129 |
Wholesale and retail trade |
83,818 |
62,953 |
351,762 |
169,861 |
70,836 |
23,099 |
58,582 |
86,418 |
190,723 |
1,098,051 |
Transport, storage and communication |
32,851 |
32,011 |
170,093 |
86,900 |
27,100 |
9,963 |
25,409 |
31,167 |
68,159 |
483,652 |
Financial, insurance, real estate and business services |
35,181 |
26,045 |
318,708 |
98,602 |
21,102 |
7,733 |
20,851 |
25,199 |
126,734 |
680,156 |
Community, social and personal services |
183,188 |
108,512 |
421,125 |
255,539 |
80,423 |
39,724 |
127,189 |
122,951 |
242,032 |
1,580,684 |
Private households |
102,863 |
104,342 |
308,037 |
173,558 |
69,568 |
26,887 |
77,355 |
93,890 |
96,602 |
1,053,103 |
Unspecified |
125,025 |
58,526 |
267,889 |
287,357 |
59,830 |
19,305 |
72,443 |
60,862 |
126,631 |
1,077,868 |
Total |
786,818 |
701,175 |
2,564,243 |
1,570,573 |
605,925 |
215,523 |
570,129 |
725,287 |
1,374,174 |
9,113,847 |
* Excluding institutions
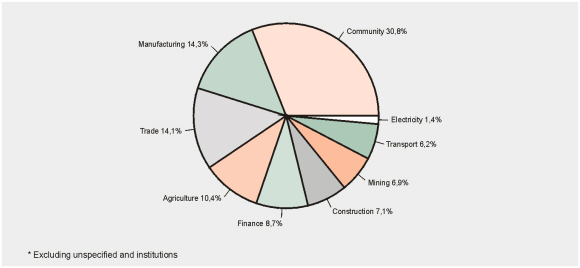
Percentage of the employed aged 15 - 65 years by
economic sector – October 1996*
• The community, social and personal service sector (including the public sector ) employs 31% of working people in the country.