2.34 Occupation by population group amongst the employed aged 15 - 65 years: Total*
African/ Black |
Coloured |
Indian/ Asian |
White |
Unspecified |
Total |
|
Legislators, senior officials and managers Professionals Technicians and associate professionals |
97,275 427,392 178,584 |
30,369 74,870 55,414 |
27,418 41,800 36,338 |
205,652 316,718 266,514 |
4,187 10,175 6,033 |
364,902 870,955 542,882 |
Clerks Service workers, shop and market sales workers |
248,276 513,660 |
105,031 92,844 |
53,687 35,663 |
294,414 171,471 |
8,545 7,170 |
709,953 820,807 |
Skilled agricultural and fishery workers Craft and related trades workers Plant and machine operators and assemblers |
267,241 892,927 585,621 |
35,428 160,345 99,096 |
1,768 42,564 35,463 |
50,809 195,469 51,847 |
2,032 10,693 5,887 |
357,278 1,301,997 777,914 |
Elementary occupations |
1,918,681 |
372,244 |
18,814 |
54,230 |
16,139 |
2,380,107 |
Unspecified/Other |
552,819 |
103,876 |
69.972 |
249,329 |
11,057 |
987,052 |
Total |
5,682,476 |
1,129,515 |
363,486 |
1,856,452 |
81,917 |
9,113,847 |
* Excluding institutions
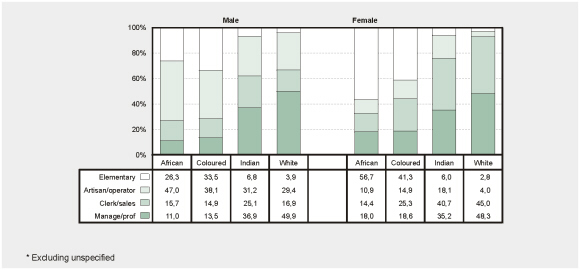
Occupational category by population group and
gender – October 1996*
• Fifty-seven percent of African women and 41% of coloured women were in elementary (unskilled) occupations, compared with 6% of Indian and 3% of white women (top sections of the four bars on the right). On the other hand, 34% of coloured men were in elementary occupations, while as many as 50% of white men were in managerial, professional or technical occupations.