2.31 Occupation by province amongst the employed aged 15 - 65 years*
Eastern |
Free |
Gauteng |
Kwazulu- |
Mpuma- |
Northern |
Northern |
North |
Western |
South |
|
Legislators, senior officials and managers |
29,938 |
18,198 |
129,220 |
49,489 |
22,300 |
5,568 |
12,726 |
21,766 |
75,697 |
364,902 |
Professionals |
98,551 |
50,859 |
254,889 |
147,634 | 43,725 | 14,632 | 75,382 | 58,396 | 126,886 | 870,955 |
Technicians and associate professionals |
48,457 |
27,466 |
194,374 |
91,364 | 23,300 | 9,251 | 20,517 | 29,615 | 98,536 | 542,882 |
Clerks |
52,913 |
40,512 |
257,236 |
109,241 | 34,134 | 14,040 | 25,442 | 42,525 | 133,910 | 709,953 |
Service workers, shop and market sales workers |
67,802 |
55,283 |
261,748 |
127,647 | 53,415 | 16,973 | 50,883 | 64,989 | 122,067 | 820,807 |
Skilled agricultural and fishery workers |
34,510 |
40,387 |
53,068 |
51,741 | 41,575 | 17,411 | 45,514 | 33,445 | 39,628 | 357,278 |
Craft and related trades workers |
90,312 |
94,141 |
416,276 |
189,098 | 99,453 | 24,074 | 80,360 | 144,225 | 164,059 | 1,301,997 |
Plant and machine operators and assemblers |
51,410 |
72,789 |
233,064 |
139,375 | 67,112 | 10,405 | 38,349 | 66,647 | 98,765 | 777,914 |
Elementary occupations |
218,125 |
252,235 |
498,908 |
377,480 | 180,427 | 82,716 | 165,017 | 200,983 | 404,217 | 2,380,107 |
Unspecified |
94,801 |
49,304 |
265,460 |
287,504 |
40,485 | 20,453 | 55,938 | 62,696 | 110,410 | 987,052 |
Total |
786,818 |
701,175 |
2,564,243 |
1,570,573 |
605,925 |
215,523 |
570,129 |
725,287 |
1,374,174 |
9,113,847 |
* Excluding institutions
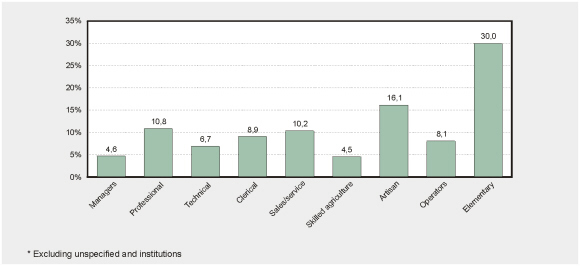
Percentage of the employed aged 15 - 65 years in
each occupational category – October 1996*
• Among the employed, 30% were in elementary (unskilled) occupations, while only 5% were in the management echelon.