2.30 Economically active population by population group amongst those aged 15 - 65 years*
African/ Black |
Coloured |
Indian/ Asian |
White |
Unspecified |
Total |
|
Employed |
||||||
Male |
3,506,509 |
633,417 |
234,583 |
1,060,736 |
46,658 |
5,481,903 |
Female |
2,175,968 |
496,099 |
128,903 |
795,716 |
35,258 |
3,631,944 |
Total |
5,682,476 |
1,129,515 |
363,486 |
1,856,452 |
81,917 |
9,113,847 |
Unemployed |
||||||
Male |
1,810,570 |
141,555 |
29,312 |
45,938 |
12,543 |
2,039,917 |
Female |
2,395,421 |
157,676 |
21,068 |
43,127 |
14,437 |
2,631,730 |
Total |
4,205,992 |
299,231 |
50,379 |
89,066 |
26,980 |
4,671,647 |
Total |
||||||
Male |
5,317,079 |
774,971 |
263,895 |
1,106,674 |
59,201 |
7,521,820 |
Female |
4,571,389 |
653,775 |
149,971 |
838,843 |
49,696 |
6,263,673 |
Total |
9,888,468 |
1,428,746 |
413,866 |
1,945,517 |
108,897 |
13,785,493 |
* Excluding institutions
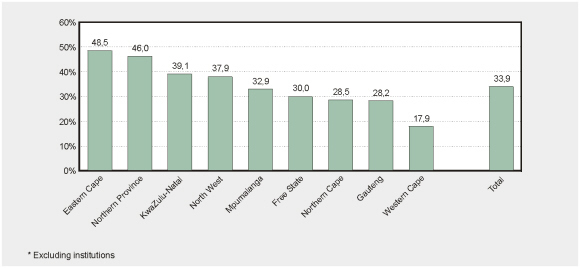
Unemployment rates (expanded definition) by
province amongst those aged 15 - 65 years – October 1996*
• Unemployment rates (expanded definition) were 34% for the country as a whole (right-hand column), but they were particularly high at 49% in Eastern Cape (left-hand column), and at 46% in Northern Province.
Unemployment rates (expanded definition) by
population group and gender – October 1996*
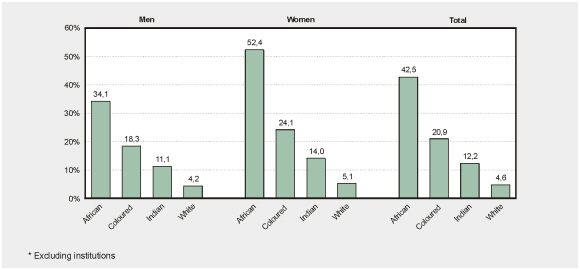
• Unemployment rates were particularly high among African women (52%: fifth column from the left) and African men (34%: left hand column).