2.29 Economically active population by province amongst those aged 15 - 65 years*
Eastern |
Free |
Gauteng |
Kwazulu- |
Mpuma- |
Northern |
Northern |
North |
Western |
South |
|
Employed |
786,818 |
701,175 |
2,564,243 |
1,570,573 |
605,925 |
215,523 |
570,129 |
725,287 |
1,374,174 |
9,113,847 |
Unemployed |
742,427 |
299,948 |
1,007,766 |
1,008,944 |
297,290 |
86,060 |
486,554 |
443,546 |
299,114 |
4,671,647 |
Total |
1,529,244 |
1,001,122 |
3,572,009 |
2,579,517 |
903,215 |
301,583 |
1,056,683 |
1,168,833 |
1,673,288 |
13,785,493 |
* Excluding institutions
• For example, the unemployment rate of 48,5%, shown in the graph for Eastern Cape (overleaf) is calculated as 742 427/152 994 expressed as a percentage.
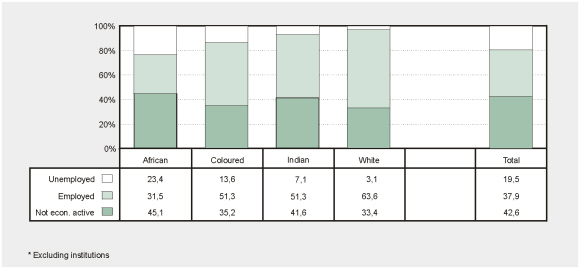
Labour market status of the population aged 15 - 65
years by population group – October 1996*
• A larger percentage of Africans (45%: bottom section of the left-hand column) and Indians (42%), compared to coloureds (35%) and whites (33%) are not economically active. Note that the unemployment rate (see next graph) is different from the percentage of unemployed people shown in this graph, because this percentage includes those who are not economically active.