2.26 Level of education by gender and population group amongst those aged 20 years or more by province (numbers)*
Eastern |
Free |
Gauteng |
Kwazulu- |
Mpuma- |
Northern |
Northern |
North |
Western |
South |
|
No schooling |
||||||||||
Male |
244,416 |
111,254 |
215,729 |
370,111 |
173,490 |
47,188 |
252,673 |
196,177 |
77,819 |
1,688,858 |
Female |
373,380 |
124,895 |
203,428 |
587,106 |
236,846 |
50,503 |
518,914 |
206,966 |
75,290 |
2,377,329 |
Total |
617,796 |
236,148 |
419,157 |
957,217 |
410,337 |
97,692 |
771,587 |
403,143 |
153,109 |
4,066,187 |
Some primary |
||||||||||
Male |
286,561 |
165,788 |
284,351 |
315,547 |
105,801 |
45,665 |
112,339 |
185,279 |
183,116 |
1,684,447 |
Female |
348,914 |
162,288 |
232,273 |
432,039 |
105,415 |
48,905 |
139,948 |
179,018 |
179,168 |
1,827,968 |
Total |
635,475 |
328,076 |
516,624 |
747,586 |
211,217 |
94,571 |
252,286 |
364,297 |
362,285 |
3,512,415 |
Complete primary |
||||||||||
Male |
105,042 |
62,452 |
150,150 |
122,329 |
47,018 |
17,679 |
52,475 |
65,707 |
92,159 |
715,010 |
Female |
159,194 |
67,857 |
145,494 |
156,106 |
48,765 |
21,899 |
71,902 |
73,296 |
112,252 |
856,765 |
Total |
264,236 |
130,308 |
295,643 |
278,435 |
95,783 |
39,578 |
124,377 |
139,004 |
204,411 |
1,571,774 |
Some secondary |
||||||||||
Male |
395,492 |
239,057 |
881,183 |
626,450 |
200,663 |
65,760 |
251,196 |
266,776 |
421,441 |
3,348,017 |
Female |
570,849 |
254,091 |
899,185 |
702,258 |
202,811 |
73,473 |
305,472 |
294,212 |
479,755 |
3,782,104 |
Total |
966,341 |
493,148 |
1,780,368 |
1,328,708 |
403,474 |
139,233 |
556,667 |
560,987 |
901,196 |
7,130,121 |
Std 10/Grade 12 |
||||||||||
Male |
147,016 |
99,080 |
524,528 |
314,007 |
98,736 |
26,170 |
134,630 |
114,094 |
202,738 |
1,660,999 |
Female |
181,621 |
100,574 |
518,216 |
351,296 |
104,366 |
27,311 |
159,074 |
122,094 |
232,882 |
1,797,435 |
Total |
328,637 |
199,654 |
1,042,744 |
665,303 |
203,102 |
53,482 |
293,703 |
236,188 |
435,620 |
3,458,434 |
Higher |
||||||||||
Male |
60,047 |
37,697 |
192,222 |
100,063 |
37,465 |
13,264 |
47,397 |
36,281 |
124,550 |
648,985 |
Female |
79,153 |
38,568 |
177,406 |
100,756 |
32,086 |
12,675 |
46,711 |
38,978 |
119,404 |
645,736 |
Total |
139,200 |
76,265 |
369,627 |
200,819 |
69,551 |
25,939 |
94,107 |
75,258 |
243,954 |
1,294,720 |
Total |
||||||||||
Male |
1,238,574 |
715,327 |
2,248,162 |
1,848,507 |
663,174 |
215,726 |
850,709 |
864,314 |
1,101,823 |
9,746,317 |
Female |
1,713,111 |
748,272 |
2,176,001 |
2,329,560 |
730,289 |
234,767 |
1,242,019 |
914,563 |
1,198,752 |
11,287,335 |
Total |
2,951,685 |
1,463,599 |
4,424,163 |
4,178,068 |
1,393,463 |
450,493 |
2,092,728 |
1,778,877 |
2,300,575 |
21,033,652 |
* Excluding unspecified/other
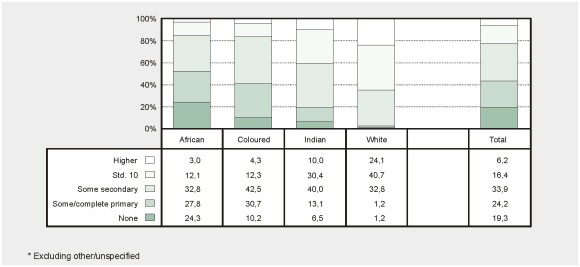
Percentage of the population aged 20 years or more
in each educational category by population group – October 1996*
• Twenty-four percent of Africans have received no education (lowest section of the left-hand column), as against 10% of coloureds, 7% of Indians and 1% of whites.