2.22 Disabled population by type and province*
Eastern |
Free |
Gauteng |
Kwazulu- |
Mpuma- |
Northern |
Northern |
North |
Western |
South |
|
Sight |
161,898 |
133,614 |
211,769 |
183,758 |
98,322 |
18,529 |
113,088 |
129,442 |
40,603 |
1,091,022 |
Hearing |
68,531 |
33,045 |
59,868 |
76,034 |
31,895 |
6,083 |
51,416 |
37,571 |
18,965 |
383,408 |
Physical |
115,717 |
41,960 |
69,936 |
129,894 |
41,381 |
9,052 |
60,078 |
54,706 |
35,051 |
557,774 |
Mental |
41,432 |
13,947 |
24,033 |
42,646 |
12,211 |
3,791 |
22,578 |
17,768 |
14,146 |
192,553 |
More than one |
35,997 |
16,461 |
26,030 |
24,895 |
9,019 |
2,403 |
16,019 |
16,913 |
6,499 |
154,236 |
Unspecified |
38,604 |
18,127 |
63,906 |
44,863 |
19,085 |
7,137 |
33,690 |
23,134 |
30,174 |
278,720 |
Total |
462,179 |
257,154 |
455,541 |
502,090 |
211,913 |
46,995 |
296,870 |
279,534 |
145,438 |
2,657,714 |
* Excluding institutions
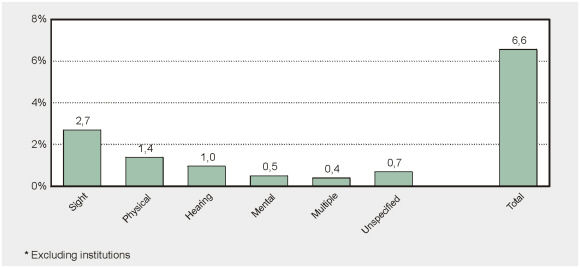
Percentage of the population with disabilities
– October 1996*
• Seven percent of the population (excluding institutions) was classified as disabled (column on the right). Visual disabilities (3%: column on the left) are the most common.