2.21 Age distribution in five-year intervals by population group: Female
African/ Black |
Coloured |
Indian/ Asian |
White |
Unspecified |
Total |
|
0 - 4 |
1,834,026.89 |
192,534.30 |
42,750.61 |
132,708.98 |
24,837.18 |
2,226,857.96 |
5 - 9 |
1,914,746.90 |
198,921.51 |
46,793.57 |
151,685.09 |
23,012.61 |
2,335,159.67 |
10 - 14 |
1,896,320.61 |
201,642.21 |
51,911.89 |
173,809.38 |
21,656.78 |
2,345,340.87 |
15 - 19 |
1,718,702.05 |
175,255.22 |
49,690.94 |
168,911.70 |
17,943.00 |
2,130,502.90 |
20 - 24 |
1,644,350.09 |
175,506.15 |
51,827.95 |
176,211.20 |
16,539.49 |
2,064,434.88 |
25 - 29 |
1,381,714.37 |
169,786.73 |
47,197.49 |
179,771.87 |
14,193.20 |
1,792,663.65 |
30 - 34 |
1,219,386.05 |
160,346.89 |
45,181.80 |
172,732.37 |
13,054.66 |
1,610,701.76 |
35 - 39 |
1,005,642.63 |
135,771.38 |
40,888.05 |
175,529.13 |
10,968.51 |
1,368,799.70 |
40 - 44 |
790,311.81 |
110,044.30 |
37,526.44 |
161,379.87 |
8,765.68 |
1,108,028.10 |
45 - 49 |
590,609.28 |
85,261.44 |
32,570.86 |
148,229.62 |
7,038.46 |
863,709.66 |
50 - 54 |
444,591.73 |
63,455.32 |
25,900.96 |
129,082.09 |
5,388.04 |
668,418.14 |
55 - 59 |
401,981.83 |
51,262.81 |
19,319.95 |
109,018.15 |
4,675.51 |
586,258.25 |
60 - 64 |
381,795.61 |
45,229.85 |
14,888.67 |
92,438.20 |
4,130.80 |
538,483.13 |
65 - 69 |
326,037.64 |
30,814.10 |
10,017.44 |
84,604.17 |
3,400.50 |
454,873.85 |
70 - 74 |
188,744.00 |
20,111.89 |
6,154.15 |
69,658.93 |
2,374.94 |
287,043.92 |
75 - 79 |
164,642.50 |
12,692.64 |
3,496.81 |
52,924.12 |
1,827.40 |
235,583.47 |
80 - 84 |
70,099.57 |
7,497.05 |
1,609.34 |
36,548.04 |
1,076.56 |
116,830.56 |
85 + |
60,318.80 |
5,721.17 |
982.02 |
26,093.53 |
938.32 |
94,053.84 |
Unspecified |
176,896.64 |
13,671.19 |
4,655.55 |
30,661.44 |
9,056.34 |
234,941.16 |
Total |
16,210,918.97 |
1,855,526.15 |
533,364.51 |
2,271,997.87 |
190,877.98 |
21,062,685.47 |
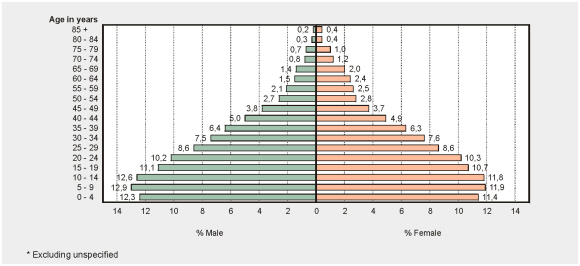
Age distribution of the African population by
gender – October 1996*
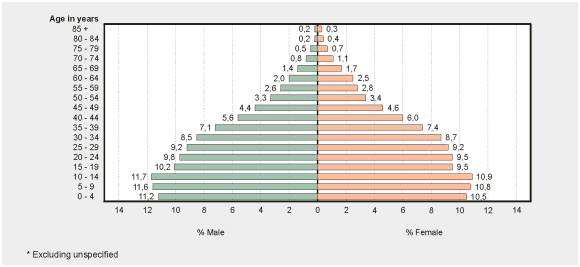
Age distribution of the coloured population by
gender – October 1996*
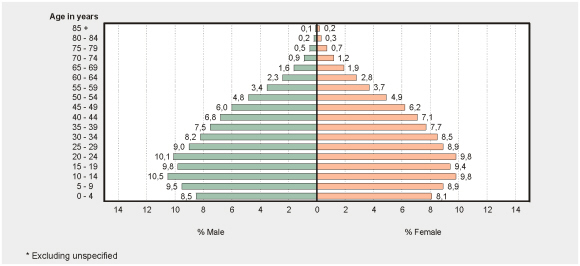
Age distribution of the Indian population by gender
– October 1996*
Age distribution of the white population by gender
– October 1996*
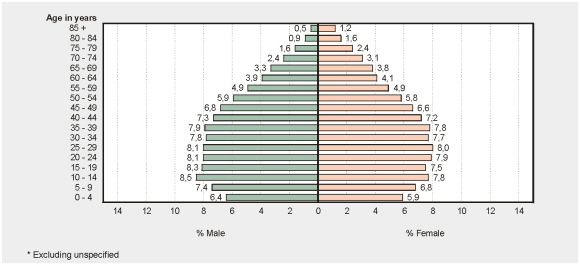
• The age pyramids vary by population group, with the African age distribution looking most like that of a developing nation, and the white age distribution looking most like that of a developed nation.