2.2 Population of South Africa by province and gender
| |
Eastern
Cape |
Free
State |
Gauteng |
Kwazulu-
Natal |
Mpuma-
langa |
Northern
Cape |
Northern
Province |
North
West |
Western
Cape |
South
Africa |
Male |
2,908,056 |
1,298,348 |
3,750,845 |
3,950,527 |
1,362,028 |
412,681 |
2,253,072 |
1,649,835 |
1,935,494 |
19,520,887 |
Female |
3,394,469 |
1,335,156 |
3,597,578 |
4,466,493 |
1,438,683 |
427,639 |
2,676,296 |
1,704,990 |
2,021,381 |
21,062,685 |
Total |
6,302,525 |
2,633,504 |
7,348,423 |
8,417,021 |
2,800,711 |
840,321 |
4,929,368 |
3,354,825 |
3,956,875 |
40,583,573 |
Percentage of women in each province and in South
Africa overall – October 1996
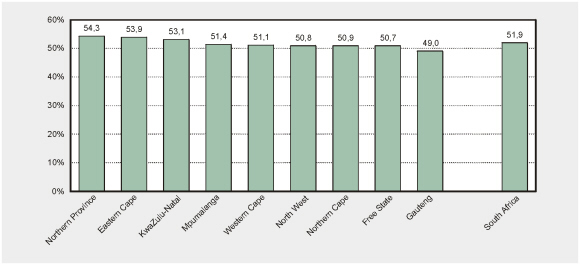
• In the country as a whole (the column on the right-hand side of the graph), and
in all provinces, except Gauteng (the second last column on the right), there is a larger
proportion of females than males. For example, 54% of people living in Northern Province
are female.