2.18 Age distribution in five-year intervals by province: Female
Eastern |
Free |
Gauteng |
Kwazulu- |
Mpuma- |
Northern |
Northern |
North |
Western |
South |
|
0 - 4 |
374,317 |
125,957 |
328,382 |
483,852 |
165,240 |
44,354 |
326,802 |
189,077 |
188,876 |
2,226,858 |
5 - 9 |
424,050 |
140,204 |
304,697 |
502,480 |
170,387 |
46,089 |
364,420 |
193,212 |
189,621 |
2,335,160 |
10 - 14 |
434,726 |
146,128 |
294,843 |
513,362 |
170,459 |
47,725 |
356,396 |
189,861 |
191,841 |
2,345,341 |
15 - 19 |
377,903 |
138,279 |
292,334 |
470,123 |
151,788 |
42,717 |
303,118 |
178,346 |
175,894 |
2,130,503 |
20 - 24 |
296,975 |
133,898 |
379,411 |
451,838 |
145,716 |
37,639 |
244,983 |
172,756 |
201,220 |
2,064,435 |
25 - 29 |
231,151 |
119,158 |
387,066 |
369,545 |
123,770 |
34,797 |
186,786 |
148,763 |
191,627 |
1,792,664 |
30 - 34 |
214,019 |
107,846 |
346,723 |
328,631 |
109,055 |
32,519 |
164,810 |
129,656 |
177,443 |
1,610,702 |
35 - 39 |
195,600 |
89,377 |
298,235 |
275,543 |
87,187 |
28,588 |
135,772 |
108,094 |
150,405 |
1,368,800 |
40 - 44 |
156,682 |
73,877 |
238,438 |
221,226 |
71,552 |
24,746 |
110,090 |
87,071 |
124,346 |
1,108,028 |
45 - 49 |
124,099 |
57,600 |
178,661 |
181,444 |
51,885 |
19,912 |
86,029 |
65,533 |
98,546 |
863,710 |
50 - 54 |
101,324 |
44,676 |
135,869 |
135,899 |
37,608 |
15,745 |
65,471 |
55,262 |
76,564 |
668,418 |
55 - 59 |
104,132 |
36,347 |
105,057 |
121,018 |
33,490 |
13,066 |
65,600 |
44,197 |
63,351 |
586,258 |
60 - 64 |
107,746 |
35,343 |
83,783 |
112,863 |
28,864 |
11,444 |
65,247 |
38,785 |
54,408 |
538,483 |
65 - 69 |
88,473 |
25,465 |
65,019 |
99,539 |
27,006 |
8,245 |
67,181 |
31,456 |
42,490 |
454,874 |
70 - 74 |
54,053 |
17,169 |
45,659 |
58,788 |
15,048 |
6,182 |
35,296 |
23,855 |
30,995 |
287,044 |
75 - 79 |
47,186 |
15,415 |
34,065 |
43,959 |
14,667 |
4,637 |
36,106 |
18,019 |
21,530 |
235,583 |
80 - 84 |
20,373 |
8,247 |
19,654 |
20,557 |
6,285 |
2,810 |
15,188 |
9,750 |
13,966 |
116,831 |
85 + |
16,670 |
6,376 |
13,923 |
16,225 |
5,216 |
2,195 |
14,432 |
8,781 |
10,234 |
94,054 |
Unspecified |
24,990 |
13,796 |
45,761 |
59,599 |
23,459 |
4,229 |
32,569 |
12,517 |
18,022 |
234,941 |
Total |
3,394,469 |
1,335,156 |
3,597,578 |
4,466,493 |
1,438,683 |
427,639 |
2,676,296 |
1,704,990 |
2,021,381 |
21,062,685 |
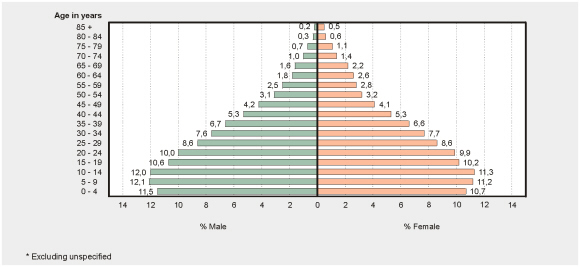
Age distribution of the population by gender –
October 1996*
• The age distribution of the South African population is starting to diverge from the pyramid structure which is typical of developing countries. There are proportionately fewer males (12%) and females (11%) in the age category 0 - 4 years (bottom line of the graph) than in the age categories 5 - 9 or 10 - 13 years. There is also a relatively large proportion, particularly females (2%) in the age category 75 years or more (top three lines of the graph).