2.15 Citizenship by population group
African/ Black |
Coloured |
Indian/ Asian |
White |
Unspecified |
Total |
|
South Africa |
30,845,009 |
3,596,369 |
1,031,820 |
4,287,161 |
368,002 |
40,128,362 |
Southern African Development Countries |
247,438 |
2,058 |
1,382 |
9,611 |
2,256 |
262,744 |
Rest of Africa |
7,087 |
162 |
350 |
1,420 |
210 |
9,229 |
Europe |
1,445 |
294 |
518 |
96,364 |
1,568 |
100,190 |
Asia |
376 |
193 |
8,857 |
2,930 |
891 |
13,246 |
North America |
222 |
75 |
93 |
4,300 |
234 |
4,923 |
Central and South America |
249 |
94 |
236 |
11,114 |
165 |
11,858 |
Australia and New Zealand |
33 |
35 |
37 |
2,582 |
68 |
2,755 |
Unspecified/Other |
25,772 |
1,165 |
2,302 |
19,215 |
1,811 |
50,266 |
Total |
31,127,631 |
3,600,446 |
1,045,596 |
4,434,697 |
375,204 |
40,583,573 |
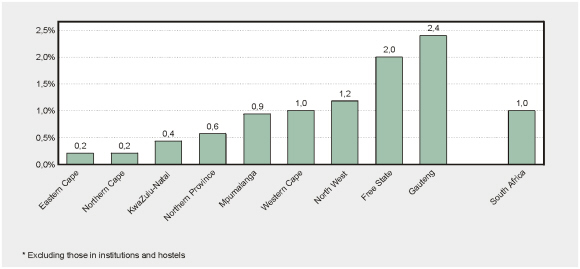
Percentage of people who are not South African
citizens in each province and in South Africa overall – October 1996*