2.12 Country of birth by province*
Eastern |
Free |
Gauteng |
Kwazulu- |
Mpuma- |
Northern |
Northern |
North |
Western |
South |
|
Afrikaans |
10.3 |
6.5 |
20.9 |
2.3 |
4.0 |
9.9 |
1.9 |
4.3 |
39.8 |
100.0 |
English |
6.7 |
1.0 |
27.4 |
38.1 |
1.6 |
0.6 |
0.6 |
1.0 |
23.0 |
100.0 |
IsiNdebele |
0.2 |
0.8 |
19.6 |
0.2 |
59.0 |
0.0 |
12.4 |
7.3 |
0.5 |
100.0 |
IsiXhosa |
73.0 |
3.4 |
7.6 |
1.8 |
0.5 |
0.7 |
0.1 |
2.5 |
10.4 |
100.0 |
IsiZulu |
0.3 |
1.4 |
17.0 |
72.4 |
7.7 |
0.0 |
0.4 |
0.9 |
0.0 |
100.0 |
Sepedi |
0.1 |
0.1 |
18.6 |
0.0 |
7.9 |
0.0 |
69.6 |
3.6 |
0.0 |
100.0 |
Sesotho |
4.5 |
52.4 |
30.7 |
1.5 |
2.9 |
0.2 |
1.8 |
5.5 |
0.5 |
100.0 |
SiSwati |
0.1 |
0.4 |
9.1 |
0.7 |
82.3 |
0.0 |
5.6 |
1.7 |
0.1 |
100.0 |
Setswana |
0.0 |
5.2 |
17.4 |
0.1 |
2.3 |
5.0 |
2.1 |
67.8 |
0.1 |
100.0 |
Tshivenda |
0.1 |
0.2 |
11.4 |
0.1 |
0.4 |
0.0 |
86.5 |
1.4 |
0.0 |
100.0 |
Xitsonga |
0.0 |
0.8 |
21.8 |
0.1 |
5.6 |
0.0 |
62.8 |
8.9 |
0.0 |
100.0 |
Other |
5.3 |
3.3 |
42.5 |
16.9 |
4.6 |
2.8 |
5.8 |
7.9 |
10.9 |
100.0 |
Unspecified |
9.8 |
4.2 |
23.4 |
21.1 |
6.4 |
2.0 |
14.7 |
5.5 |
12.8 |
100.0 |
Total |
15.5 |
6.5 |
18.1 |
20.7 |
6.9 |
2.1 |
12.1 |
8.3 |
9.7 |
100.0 |
* Excluding institutions
** Southern African Development Community
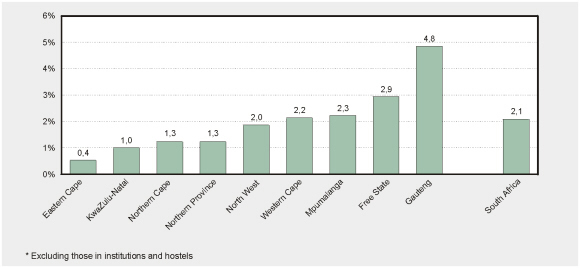
Percentage of the population not born in South
Africa in each province and in South Africa overall – October 1996*
• Altogether, 2% of the people enumerated in South Africa on census night were not born in South Africa (right-hand column of the graph). Gauteng (second last column from the right) contains the largest proportion of people who were not born in South Africa (5%), while Eastern Cape contains the lowest proportion (less than half a percentage point).