3.9 Main water supply by population group of head of household*
African/ Black |
Coloured |
Indian/ Asian |
White |
Unspecified |
Total |
|
Piped water in dwelling |
1,745,954 |
532,953 |
236,805 |
1,422,557 |
38,587 |
3,976,855 |
Piped water on site or in yard |
1,335,644 |
137,337 |
2,894 |
9,467 |
5,886 |
1,491,228 |
Public tap |
1,721,853 |
36,023 |
924 |
2,062 |
5,084 |
1,765,945 |
Water-carrier/ tanker |
106,053 |
3,949 |
235 |
600 |
367 |
111,204 |
Borehole/ rain-water tank/ well |
386,987 |
13,797 |
1,386 |
38,137 |
1,576 |
441,884 |
Dam/ river/ stream/ spring |
1,096,334 |
11,975 |
493 |
3,428 |
4,255 |
1,116,484 |
Unspecified/Other |
141,173 |
5,172 |
903 |
6,241 |
2,481 |
155,970 |
Total |
6,533,998 |
741,206 |
243,639 |
1,482,492 |
58,237 |
9,059,571 |
* Excluding institutions and hostels
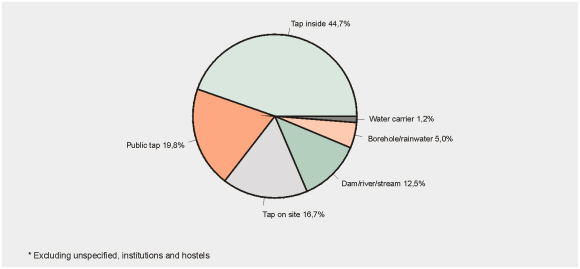
Main water source for households – October
1996*
• Fewer than half (45%: top segment of the pie diagram) of the households in the country have a tap inside the dwelling.
Percentage of households with a tap inside the
dwelling by province and in South Africa overall – October 1996*
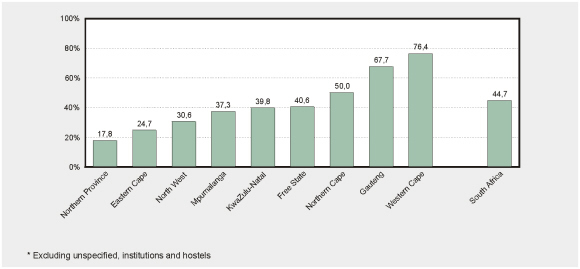
• Only 18% of households in Northern Province have taps inside the dwelling, compared with 76% in Western Cape.
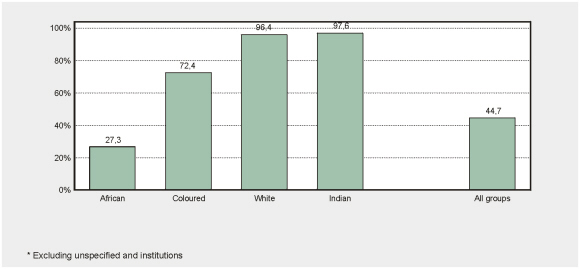
Percentage of households with taps inside the
dwelling by population group – October 1996*