3.6 Energy source for cooking, heating and lighting by province*
Eastern |
Free |
Gauteng |
Kwazulu- |
Mpuma- |
Northern |
Northern |
North |
Western |
South |
|
Energy source for cooking |
||||||||||
Electricity direct from authority |
306,964 |
261,311 |
1,429,910 |
756,333 |
213,890 |
97,247 |
188,876 |
241,967 |
750,190 |
4,246,688 |
Electricity from other source |
2,308 |
1,190 |
2,795 |
4,278 |
1,033 |
652 |
2,627 |
1,509 |
2,225 |
18,617 |
Gas |
44,603 |
24,827 |
34,285 |
52,691 |
14,323 |
17,753 |
16,555 |
33,527 |
48,093 |
286,657 |
Paraffin |
390,765 |
223,265 |
379,994 |
296,017 |
104,321 |
33,091 |
120,393 |
264,253 |
131,761 |
1,943,862 |
Wood |
503,438 |
57,611 |
18,083 |
490,122 |
155,675 |
34,458 |
620,960 |
148,532 |
44,341 |
2,073,219 |
Coal |
3,785 |
43,874 |
82,696 |
38,877 |
106,621 |
2,573 |
21,122 |
20,621 |
662 |
320,830 |
Animal dung |
71,371 |
9,660 |
255 |
10,533 |
2,842 |
109 |
5,059 |
6,206 |
34 |
106,068 |
Unspecified |
9,113 |
3,275 |
16,150 |
12,085 |
5,304 |
1,100 |
6,865 |
4,028 |
5,709 |
63,629 |
Total |
1,332,348 |
625,011 |
1,964,168 |
1,660,934 |
604,010 |
186,984 |
982,457 |
720,643 |
983,015 |
9,059,571 |
Energy source for heating |
||||||||||
Electricity direct from authority |
276,595 |
242,943 |
1,376,783 |
716,048 |
197,925 |
89,271 |
179,581 |
230,417 |
700,721 |
4,010,283 |
Electricity from other source |
2,156 |
1,095 |
3,491 |
4,400 |
1,218 |
935 |
3,080 |
1,594 |
2,596 |
20,567 |
Gas |
11,810 |
9,064 |
21,412 |
22,346 |
6,104 |
3,151 |
8,514 |
10,536 |
14,752 |
107,689 |
Paraffin |
357,587 |
134,747 |
184,209 |
185,592 |
49,018 |
18,296 |
94,527 |
135,717 |
135,272 |
1,294,964 |
Wood |
585,435 |
85,670 |
48,357 |
576,192 |
175,971 |
56,069 |
606,342 |
200,810 |
82,879 |
2,417,724 |
Coal |
14,010 |
124,060 |
257,104 |
62,912 |
133,542 |
10,106 |
36,369 |
95,072 |
2,458 |
735,632 |
Animal dung |
49,232 |
10,481 |
497 |
10,665 |
2,640 |
183 |
5,056 |
5,653 |
41 |
84,447 |
Unspecified |
35,523 |
16,952 |
72,316 |
82,779 |
37,593 |
8,973 |
48,989 |
40,845 |
44,297 |
388,266 |
Total |
1,332,348 |
625,011 |
1,964,168 |
1,660,934 |
604,010 |
186,984 |
982,457 |
720,643 |
983,015 |
9,059,571 |
Energy source for lighting |
||||||||||
Electricity direct from authority |
416,112 |
355,025 |
1,559,657 |
883,944 |
339,865 |
128,599 |
355,204 |
315,170 |
835,066 |
5,188,644 |
Electricity from other source |
5,993 |
2,061 |
3,255 |
5,458 |
1,959 |
3,537 |
4,585 |
2,430 |
2,903 |
32,182 |
Gas |
7,715 |
1,520 |
3,424 |
8,006 |
4,673 |
501 |
5,191 |
1,865 |
2,616 |
35,512 |
Paraffin |
514,529 |
46,011 |
48,274 |
86,235 |
61,594 |
14,314 |
241,400 |
50,657 |
80,998 |
1,144,014 |
Candles |
377,213 |
217,334 |
331,174 |
661,996 |
189,753 |
38,897 |
364,817 |
345,339 |
56,507 |
2,583,031 |
Unspecified |
10,786 |
3,060 |
18,384 |
15,294 |
6,165 |
1,135 |
11,261 |
5,181 |
4,924 |
76,190 |
Total |
1,332,348 |
625,011 |
1,964,168 |
1,660,934 |
604,010 |
186,984 |
982,457 |
720,643 |
983,015 |
9,059,571 |
* Excluding institutions and hostels
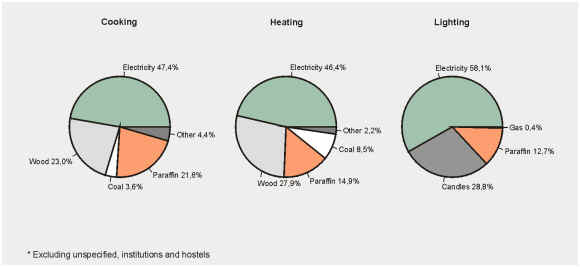
Main energy sources used by households for cooking,
heating and lighting – October 1996*
• Forty-seven percent of South African households mainly use electricity for cooking, while 23% mainly use wood, and 22% paraffin. Similar to cooking, 46% of South African households use electricity for heating, while proportionately more – 28% – use wood for heating, and 15% use paraffin. On the other hand, 58% of households use electricity for lighting purposes, while 29% use candles, and 13% use paraffin.