3.5 Number of rooms by population group of head of household with specific number of rooms*
African/ Black |
Coloured |
Indian/ Asian |
White |
Unspecified |
Total |
|
1** |
1,438,167 |
68,205 |
4,109 |
27,481 |
6,076 |
1,544,039 |
2 |
1,199,935 |
104,653 |
12,045 |
52,867 |
6,015 |
1,375,514 |
3 |
947,655 |
106,250 |
25,810 |
120,393 |
6,429 |
1,206,537 |
4 |
1,380,642 |
215,596 |
63,922 |
247,191 |
12,974 |
1,920,326 |
5 |
599,183 |
155,685 |
64,913 |
285,206 |
11,058 |
1,116,046 |
6 |
421,776 |
51,058 |
37,263 |
284,651 |
5,914 |
800,663 |
7 |
210,232 |
19,515 |
16,315 |
182,248 |
3,051 |
431,360 |
8 |
118,639 |
8,359 |
9,341 |
121,611 |
1,649 |
259,599 |
9 |
82,979 |
5,370 |
4,516 |
69,789 |
1,721 |
164,376 |
10 + |
64,020 |
2,893 |
4,469 |
72,736 |
811 |
144,929 |
Unspecified/Other |
70,770 |
3,621 |
937 |
18,319 |
2,537 |
96,183 |
Total |
6,533,998 |
741,206 |
243,639 |
1,482,492 |
58,237 |
9,059,571 |
* Excluding institutions and hostels
** More than one household sharing a single room. For example the African/Black column shows that, among 6,5 million households, 1 438 167 live in a single room.
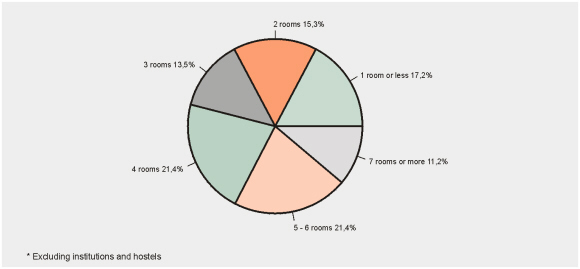
Distribution of number of rooms per household
– October 1996*
• Forty-six percent of households (summing up the three segments at the top of the pie) live in three or fewer rooms (including kitchens, but excluding bathrooms).
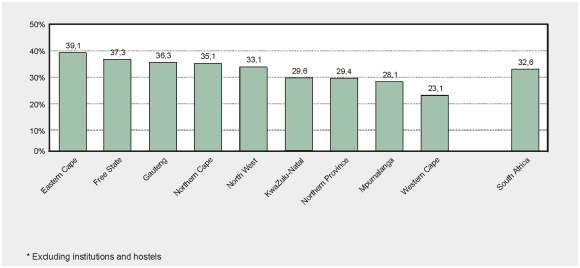
Percentage of households living in two or fewer
rooms by province and in South Africa overall – October 1996*