3.2 Type of dwelling by population group of head of household*
African/ Black |
Coloured |
Indian/ Asian |
White |
Unspecified |
Total |
|
House or brick structure on a separate stand or yard |
2,673,181 |
452,258 |
140,641 |
1,034,346 |
31,160 |
4,331,586 |
Traditional dwelling/ hut/ structure made of traditional materials |
1,612,700 |
13,955 |
1,329 |
10,483 |
5,922 |
1,644,388 |
Flat in a block of flats |
153,096 |
58,042 |
34,279 |
208,120 |
4,631 |
458,167 |
Town/ cluter/ semi-detached house (simplex, duplex or triplex) |
96,886 |
98,546 |
46,508 |
135,073 |
4,526 |
381,541 |
Unit-in retirement village |
7,354 |
802 |
340 |
31,748 |
190 |
40,433 |
House/ flat/ room, in backyard |
401,251 |
37,787 |
13,575 |
28,124 |
2,723 |
483,460 |
Informal dwelling/ shack, in backyard |
373,294 |
26,479 |
788 |
1,060 |
1,708 |
403,329 |
| Informal dwelling/ shack, NOT in backyard, e.g. in an informal/sqatter settlement | 1,013,343 |
31,103 |
1,083 |
912 |
3,243 |
1,049,686 |
Room/ flatlet not in backyard but on a shared property |
107,584 |
12,059 |
3,268 |
15,207 |
1,513 |
139,632 |
Caravan/ tent |
11,418 |
2,752 |
75 |
2,727 |
154 |
17,126 |
None/ homeless |
1,982 |
249 |
19 |
198 |
22 |
2,470 |
Unspecified |
81,908 |
7,173 |
1,735 |
14,492 |
2,445 |
107,753 |
Total |
6,533,998 |
741,206 |
243,639 |
1,482,492 |
58,237 |
9,059,571 |
* Excluding institutions and hostels
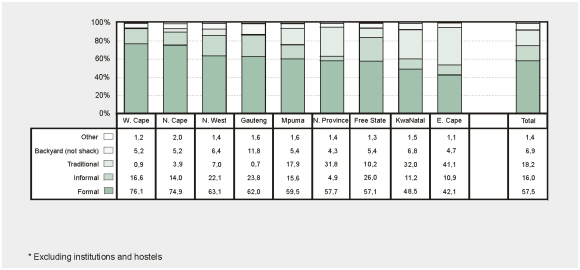
Type of dwellings in which households live by
province – October 1996*
• More than half the households in the country (58%; last column on the right, bottom section ) live in formal dwellings.
• A large proportion of households in Free State (26%), Gauteng (24%) live in informal dwellings (shacks), while a large proportion of households in Eastern Cape (41%) and Northern Cape (39%) live in traditional dwellings.