3.15 Refuse removal by population group of head of household*
African/ Black |
Coloured |
Indian/ Asian |
White |
Unspecified |
Total |
|
Removed by local authority at least once a week |
2,430,509 |
595,389 |
233,415 |
1,340,728 |
41,074 |
4,641,115 |
Removed by local authority less often |
182,987 |
8,919 |
888 |
6,928 |
754 |
200,477 |
Communal refuse dump |
241,012 |
31,334 |
658 |
13,023 |
1,173 |
287,199 |
Own refuse dump |
2,719,220 |
80,172 |
5,404 |
91,910 |
8,879 |
2,905,586 |
No rubbish disposal |
838,801 |
12,575 |
1,287 |
6,855 |
3,207 |
862,726 |
Unspecified/Other |
121,470 |
12,816 |
1,987 |
23,046 |
3,150 |
162,469 |
Total |
6,533,998 |
741,206 |
243,639 |
1,482,492 |
58,237 |
9,059,571 |
* Excluding institutions and hostels
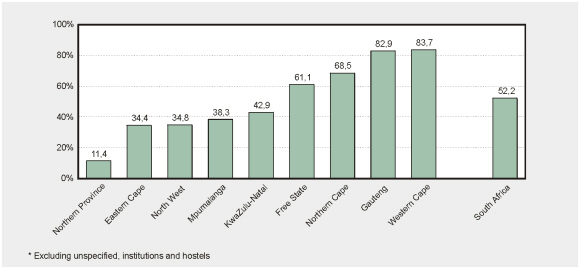
Percentage of households with refuse removal at
least once a week by province and in South Africa overall – October 1996*
• Just over half (52%) of South African households have a refuse removal service which operates at least once a week.