3.11 Telephone facilities by population group of head of household*
African/ Black |
Coloured |
Indian/ Asian |
White |
Unspecified |
Total |
|
Telephone in dwelling/ cellular phone |
740,783 |
321,849 |
187,433 |
1,312,267 |
28,917 |
2,591,249 |
Telephone at a neighbour nearby |
342,015 |
109,544 |
21,792 |
18,851 |
3,460 |
495,662 |
A public telephone nearby |
2,916,226 |
194,306 |
24,753 |
96,622 |
13,526 |
3,245,433 |
At another location nearby eg. work |
390,616 |
57,987 |
4,398 |
31,434 |
2,303 |
486,736 |
At another location not nearby |
511,573 |
12,128 |
1,194 |
3,142 |
1,748 |
529,785 |
No access to a telephone |
1,592,049 |
42,220 |
3,269 |
12,211 |
5,993 |
1,655,743 |
Not stated |
40,736 |
3,171 |
801 |
7,965 |
2,290 |
54,963 |
Total |
6,533,998 |
741,206 |
243,639 |
1,482,492 |
58,237 |
9,059,571 |
* Excluding institutions and hostels
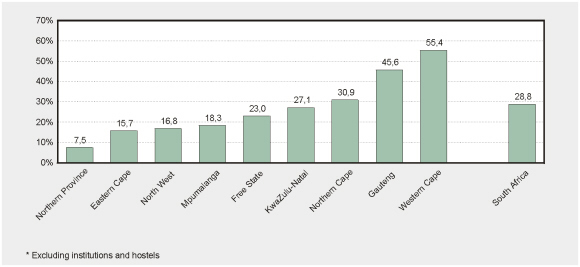
Percentage of households which have a telephone in
the dwelling or a cellular telephone, by province and in South Africa overall –
October 1996*