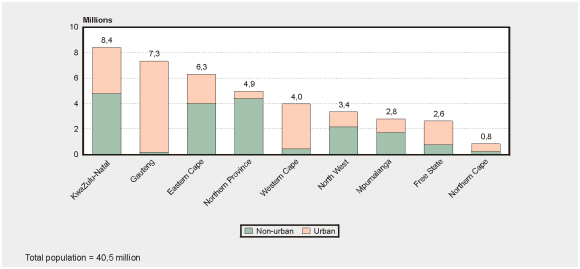
2.4 Urban and non-urban population by province (percentages)
| |
Eastern
Cape |
Free
State |
Gauteng |
Kwazulu
Natal |
Mpuma-
langa |
Northern
Cape |
Northern
Province |
North
West |
Western
Cape |
South
Africa |
Urban |
36.6 |
68.6 |
97.0 |
43.1 |
39.1 |
70.1 |
11.0 |
34.9 |
88.9 |
53.7 |
Non-urban |
63.4 |
31.4 |
3.0 |
56.9 |
60.9 |
29.9 |
89.0 |
65.1 |
11.1 |
46.3 |
Total |
100.0 |
100.0 |
100.0 |
100.0 |
100.0 |
100.0 |
100.0 |
100.0 |
100.0 |
100.0 |
Number of people in each province by urban or
non-urban place of enumeration – October 1996

• Gauteng and Western Cape are largely urban (as shown by the upper portion of the
respective bars), while Northern Province, North West and Eastern Cape are largely
non-urban. The figures above each bar show the totals of each province, in millions.