2.25 Level of education amongst aged 20 years or more by province (percenatges)*
Eastern |
Free |
Gauteng |
Kwazulu- |
Mpuma- |
Northern |
Northern |
North |
Western |
South |
|
No schooling |
20.9 |
16.1 |
9.5 |
22.9 |
29.4 |
21.7 |
36.9 |
22.7 |
6.7 |
19.3 |
Some primary |
21.5 |
22.4 |
11.7 |
17.9 |
15.2 |
21.0 |
12.1 |
20.5 |
15.7 |
16.7 |
Complete primary |
9.0 |
8.9 |
6.7 |
6.7 |
6.9 |
8.8 |
5.9 |
7.8 |
8.9 |
7.5 |
Some secondary |
32.7 |
33.7 |
40.2 |
31.8 |
29.0 |
30.9 |
26.6 |
31.5 |
39.2 |
33.9 |
Std 10/Grade 12 |
11.1 |
13.6 |
23.6 |
15.9 |
14.6 |
11.9 |
14.0 |
13.3 |
18.9 |
16.4 |
Higher |
4.7 |
5.2 |
8.4 |
4.8 |
5.0 |
5.8 |
4.5 |
4.2 |
10.6 |
6.2 |
Total |
100.0 |
100.0 |
100.0 |
100.0 |
100.0 |
100.0 |
100.0 |
100.0 |
100.0 |
100.0 |
* Excluding unspecified/other
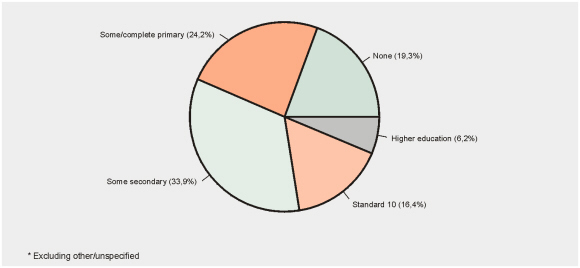
Percentage of the population aged 20 years or more
by highest level of education completed – October 1996*
• Almost 20% of South Africans aged 20 years or more have received no education, while only 6% have post-school qualifications.
Percentage of the population aged 20 years or more
with no education in each province and in South Africa overall – October 1996*
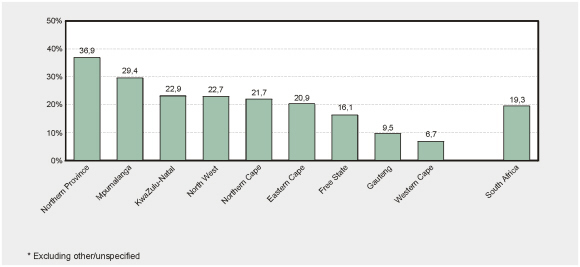
• A larger proportion of people in Northern Province (37%) and Mpumalanga (29%) have received no education, compared to Gauteng (10%) and Western Cape (7%).
Percentage of the population aged 20 years or more
with tertiary qualifications in each province and in South Africa overall – October
1996*
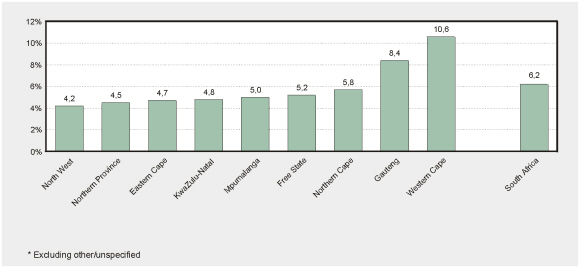
• A larger percentage of people living in Gauteng (8%) and Western Cape (11%) have post-school educational qualifications than in the other provinces.