2.10 Home language by population group (percentages)*
| |
African
/ Black |
Coloured |
Indian
/ Asian |
White |
Unspecified
/Other |
Total |
Afrikaans |
0.7 |
82.1 |
1.5 |
58.5 |
27.7 |
14.4 |
English |
0.4 |
16.4 |
94.4 |
39.1 |
23.2 |
8.6 |
IsiNdebele |
1.9 |
0.1 |
0.0 |
0.1 |
0.9 |
1.5 |
IsiXhosa |
23.1 |
0.3 |
0.1 |
0.1 |
9.9 |
17.9 |
IsiZulu |
29.5 |
0.2 |
0.2 |
0.1 |
16.9 |
22.9 |
Sepedi |
11.9 |
0.1 |
0.0 |
0.0 |
5.6 |
9.2 |
Sesotho |
10.0 |
0.2 |
0.0 |
0.0 |
4.0 |
7.7 |
SiSwati |
3.3 |
0.0 |
0.0 |
0.0 |
1.4 |
2.5 |
Setswana |
10.6 |
0.4 |
0.0 |
0.0 |
4.4 |
8.2 |
Tshivenda |
2.8 |
0.0 |
0.0 |
0.0 |
1.5 |
2.2 |
Xitsonga |
5.6 |
0.0 |
0.0 |
0.0 |
2.8 |
4.4 |
Other |
0.3 |
0.2 |
3.7 |
2.0 |
1.7 |
0.6 |
Total |
100.0 |
100.0 |
100.0 |
100.0 |
100.0 |
100.0 |
* Excluding those who did not specify their
language.
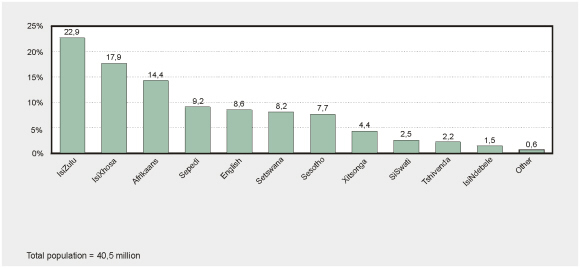
Percentage of the population speaking each official
language as their first home language – October 1996

• The most commonly-spoken first home language in South Africa is IsiZulu (spoken by
23% of the population: the column on the left of the graph), followed by IsiXhosa (18%:
second column from the left). Afrikaans (14%) and English (9%), while widely spoken in all
provinces, are less frequently used as first home languages than certain of the indigenous
languages.