3.13 Toilet facilities by population group of head of household*
African/ Black |
Coloured |
Indian/ Asian |
White |
Unspecified |
Total |
|
Flush toilet or chemical toilet |
2,212,402 |
590,484 |
237,838 |
1,470,664 |
41,465 |
4,552,854 |
Pit latrine |
2,844,863 |
57,716 |
4,447 |
3,869 |
8,699 |
2,919,594 |
Bucket latrine |
364,605 |
52,927 |
280 |
638 |
1,734 |
420,185 |
None of the above |
1,074,691 |
37,539 |
428 |
1,335 |
4,139 |
1,118,132 |
Unspecified/Other |
37,437 |
2,539 |
647 |
5,985 |
2,199 |
48,807 |
Total |
6,533,998 |
741,206 |
243,639 |
1,482,492 |
58,237 |
9,059,571 |
* Excluding institutions and hostels
Main toilet facility used by households –
October 1996*

• Just over half (51%) of the population have flush or chemical toilets (upper half of the pie diagram).
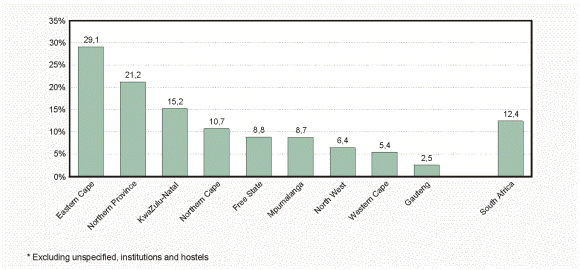
Percentage of households without toilet facilities
by province and in South Africa overall – October 1996*

• Twenty-nine percent of households in Eastern Cape do not have any toilet facilities, compared with 3% in Gauteng.